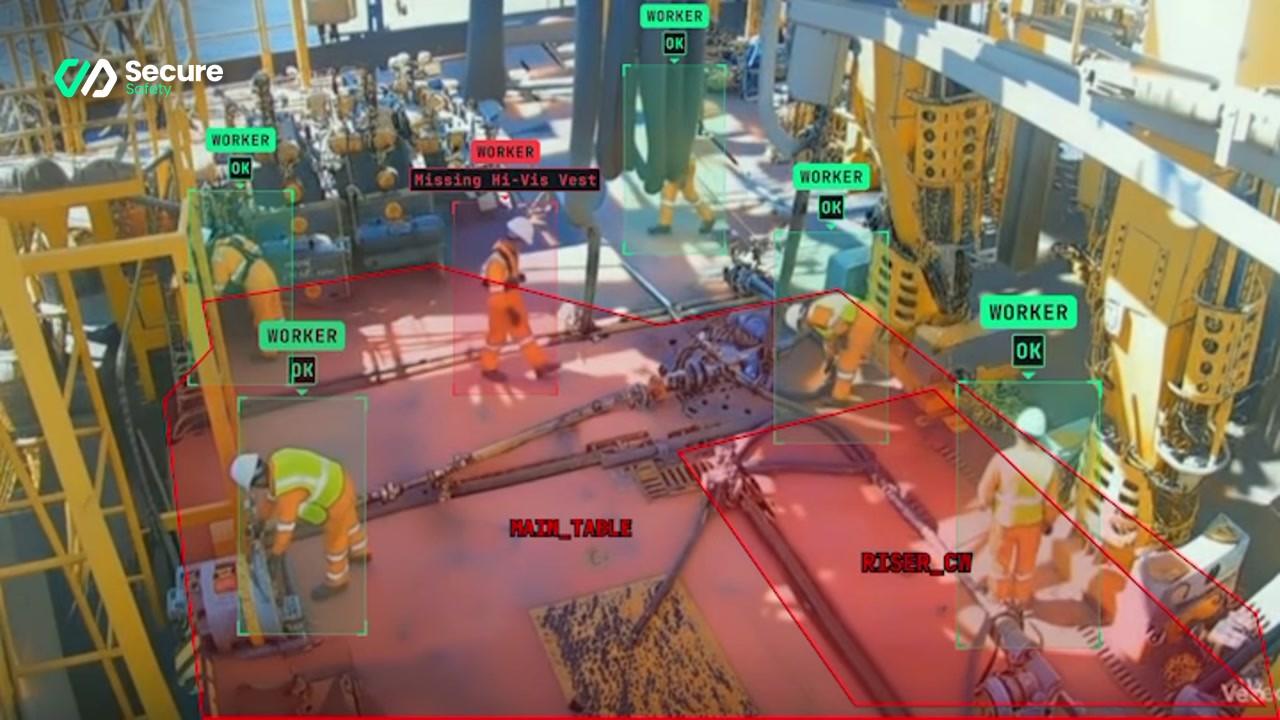
\"SecureSafety zone detection — the result of correctly tuned sensitivity thresholds, not uniform settings.\"
Six weeks after deployment, the safety manager at a large distribution centre stops checking the alerts dashboard multiple times per shift. Then once per shift. Then once per day. By week eight, he looks at it when he happens to remember, which is not often. The system is running perfectly. Every camera is online. The detections are being logged correctly. But the previous 24-hour period shows 447 events, and at least 390 of them are the same articulated lorry passing through the same goods-in entrance, the same group of pedestrians taking the same authorised shortcut across the loading yard, and the same maintenance team crossing the same zone boundary on their way to the roof plant room — as they do, three times every shift.
The detection has been configured at maximum sensitivity, uniformly, across the entire forty-camera estate. And so what was deployed as a safety intelligence tool has become, within two months, an alarm system that no one trusts and most people have stopped reading.
This is alert fatigue. It is not a technology failure. It is a configuration failure. And it is, by some margin, the most common reason that safety AI deployments fail to deliver their potential.
Why uniform sensitivity creates the problem
The logic behind setting high sensitivity uniformly across a site is understandable. The system has been deployed to prevent harm, and the instinct is to configure it so that nothing is missed. At maximum sensitivity, the system flags every possible event in every possible zone. In theory, no hazard slips through.
In practice, the effect is the opposite. A site is not a uniform risk environment. The loading bay where heavy vehicles manoeuvre at speed is not the same risk environment as the visitor car park. The controlled access corridor outside the chemical storage area is not the same risk environment as the canteen yard. A pedestrian crossing the boundary of a high-voltage exclusion zone without authorisation is a different class of event from the same pedestrian crossing the soft boundary of the general visitor circulation area.
When all of these events generate alerts of the same priority at the same sensitivity, the safety-critical events are buried inside a volume of advisory events that no operational team has the bandwidth to process. The signal-to-noise ratio collapses. Operators start skipping events. Acknowledgement rates fall. The statistical consequence — and the field evidence from deployments that have experienced it — is that the probability of a safety-critical event being missed is actually higher after alert fatigue sets in than it would have been with a more conservative, well-tuned configuration.
ISO 45001:2018, Section 9, requires organisations to monitor and measure performance against objectives, including the effectiveness of operational controls. An alert system that produces data nobody reads is not a functioning performance control — it is a liability that provides a false impression of monitoring without the substance of it.
The three dimensions of detection tuning
There are three independent parameters that together define how sensitive a detection configuration is for a given camera and detection type.
Sensitivity threshold. This is the model confidence level required before an event is classified as a detection. A threshold of 0.9 means the system only alerts when the model is 90 per cent or more confident that what it has seen constitutes the specified event. A threshold of 0.6 means it alerts on detections the model is only 60 per cent confident about. Higher thresholds produce fewer false positives but increase the risk of missing a genuine event with unusual visual characteristics. Lower thresholds catch more events but generate more noise.
Dwell time before alert. This is the duration a detection must be sustained before an alert fires. A dwell time of zero means the alert fires the instant the detection threshold is crossed. A dwell time of five seconds means the system waits five seconds of continuous detection before alerting — filtering out transient boundary crossings, vehicles passing close to the edge of an exclusion zone without entering it, and pedestrians who step momentarily into a zone and immediately correct themselves. Dwell time tuning is the single most effective tool for reducing noise in vehicle-pedestrian proximity and zone-entry detection.
Confidence minimum over time. Some deployments add a third dimension: requiring not just that the confidence threshold is crossed, but that it is sustained at or above a minimum level for the duration of the dwell period. This filters out detections where the model's confidence fluctuates — which often indicates a marginal, borderline event rather than a genuine safety event.
These three parameters interact. Raising the confidence threshold while lowering the dwell time produces different characteristics from raising the dwell time while lowering the confidence threshold. Effective tuning calibrates all three against the specific risk and operational characteristics of each zone.
Mapping your site into risk tiers
Before any configuration decisions are made, the site needs to be mapped into risk tiers. Three tiers cover most industrial sites.
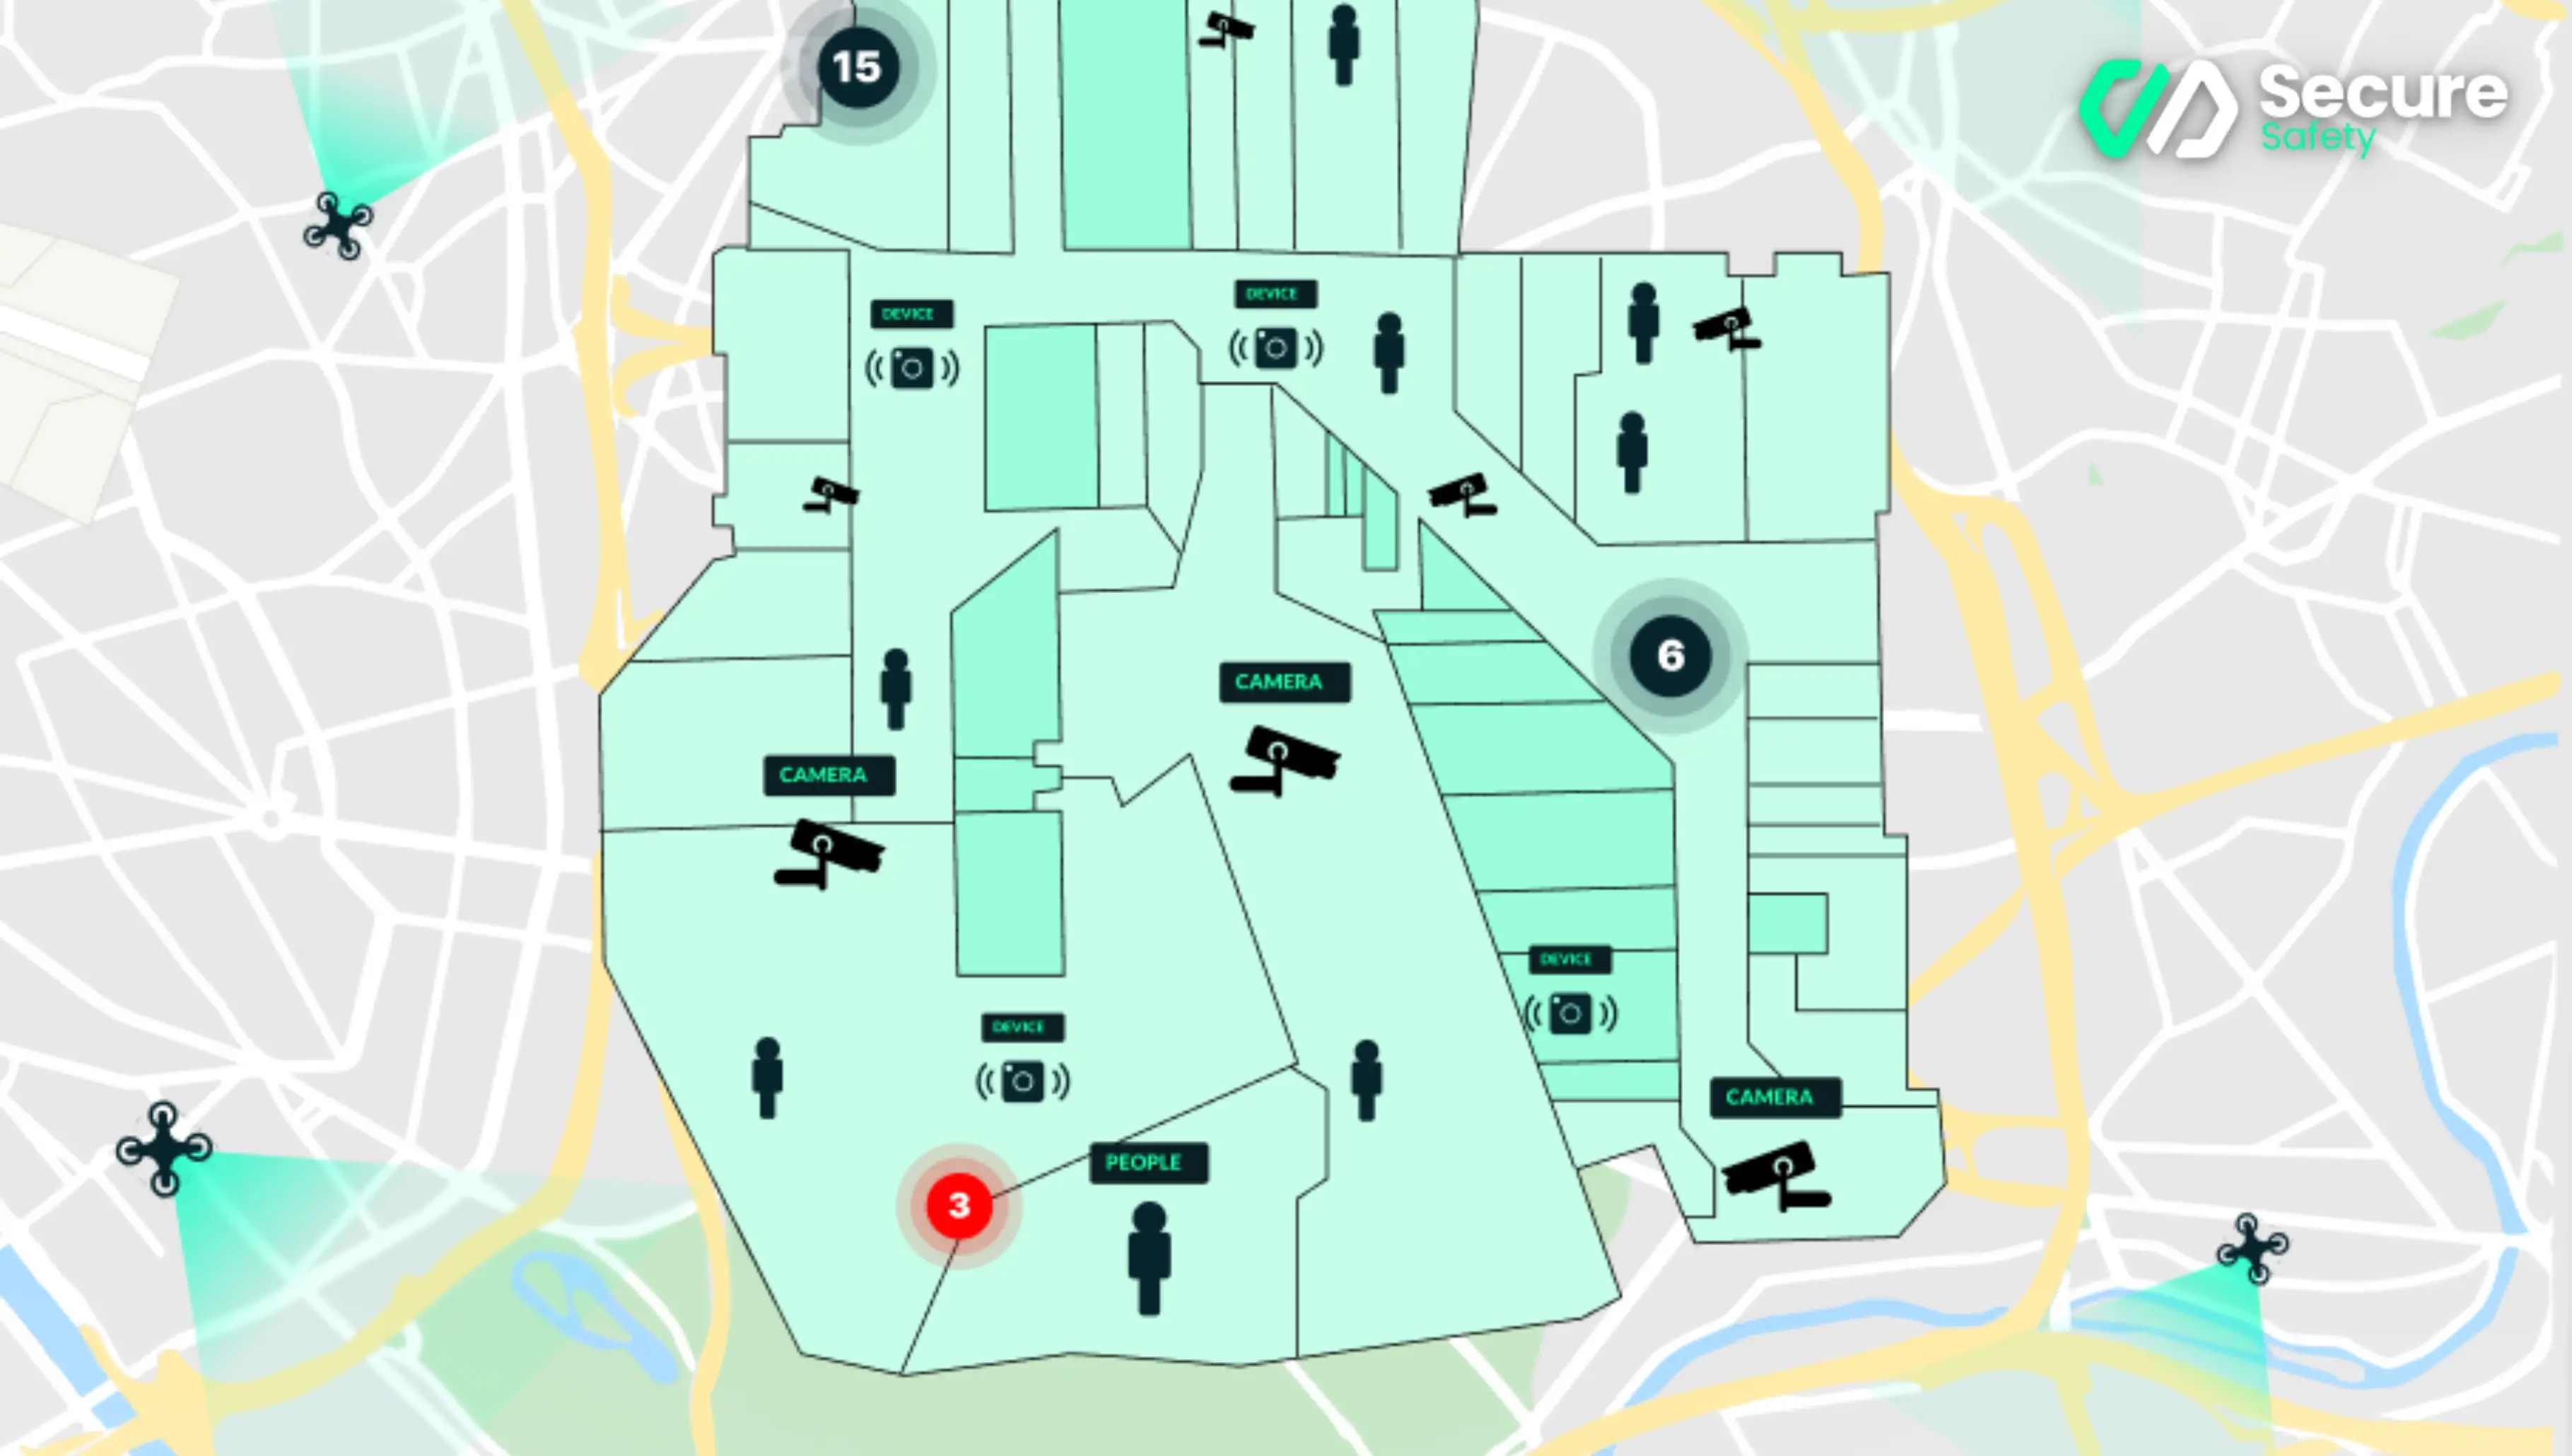 Zone risk tiers on the SecureSafety site map. Critical zones run at maximum sensitivity; open zones suppress individual event alerts in favour of aggregate trend data. No two zones should share the same threshold.
Critical zones are areas where the consequences of the hazard being monitored are potentially severe and where there is limited margin for the event to develop before harm occurs. Examples include: active vehicle exclusion zones adjacent to pedestrian routes; loading and discharge areas where heavy loads are suspended; areas with live electrical equipment; confined space entry points; chemical storage and handling areas; and drill floors or similar high-energy work areas. In critical zones, sensitivity is configured high, dwell times are short, and the alert priority is safety-critical. False positives are an acceptable cost.
Controlled zones are areas with a defined risk that is managed by existing procedural controls, where the AI detection adds a layer of assurance rather than representing the primary control. Examples include: access-controlled corridors where tailgating is the primary concern; general yard areas where vehicle speeds are monitored; PPE check zones at major entry points; and smoking or mobile phone exclusion areas. In controlled zones, sensitivity is moderate, dwell times are calibrated to exclude authorised patterns, and alert priority is advisory with a longer acknowledgement window.
Open zones are areas with low hazard density where detection is primarily for aggregated pattern data rather than real-time response — people counting for evacuation planning, general circulation patterns, shift start and end monitoring. In open zones, alert thresholds are high, individual event alerts may be suppressed in favour of batch reporting, and the primary output is a data feed to the analytics dashboard rather than a real-time notification.
Every camera on the site is assigned to a zone tier before configuration begins. This assignment drives all subsequent parameter decisions.
The configuration matrix
The following matrix provides reference parameter ranges for the three zone tiers across the most common detection types. These are starting points to be refined during commissioning, not fixed values.
| Detection Type | Critical Zone | Controlled Zone | Open Zone |
|---|---|---|---|
| Pedestrian in vehicle exclusion zone | Confidence ≥0.85, dwell 0–2s, Priority: Critical | Confidence ≥0.80, dwell 3–5s, Priority: Advisory | Not typically deployed |
| Missing PPE at entry | Confidence ≥0.80, dwell 2–3s, Priority: Critical | Confidence ≥0.75, dwell 5–8s, Priority: Advisory | Confidence ≥0.70, dwell 10s, Priority: Log only |
| Restricted zone entry | Confidence ≥0.85, dwell 0–1s, Priority: Critical | Confidence ≥0.80, dwell 3–5s, Priority: Advisory | Not typically deployed |
| Fire or smoke | Confidence ≥0.80, dwell 0–2s, Priority: Critical | Confidence ≥0.80, dwell 0–3s, Priority: Critical | Confidence ≥0.80, dwell 3–5s, Priority: Critical |
| Speed monitoring | Not applicable | Confidence ≥0.85, dwell 3–5s, Priority: Advisory | Confidence ≥0.75, dwell 5s, Priority: Log only |
| Fatigue/inattentiveness | Confidence ≥0.80, dwell 30s, Priority: Welfare alert | Confidence ≥0.75, dwell 45s, Priority: Welfare alert | Not typically deployed |
| Blocked exit route | Confidence ≥0.80, dwell 30–60s, Priority: Advisory | Confidence ≥0.80, dwell 60s, Priority: Advisory | Confidence ≥0.75, dwell 120s, Priority: Log only |
Fire and smoke detection is the one category where critical-level configuration is appropriate regardless of zone tier. There is no low-risk zone when it comes to fire.
Time-based and shift tuning
Risk does not stay constant throughout the day. Configuration that does not reflect this is systematically miscalibrated for half the operational cycle.
In a distribution centre, the goods-in yard is at its highest risk level during the two-hour peak delivery window in the morning. During that window, vehicle density is high, pedestrian crossing frequency is high, and the margin for a vehicle-pedestrian conflict is smallest. The same yard at 2200 hours, with one overnight lorry per hour, is a materially different risk environment.
Time-based tuning — lowering dwell times and raising sensitivity during peak risk windows, extending dwell times and moderating sensitivity during low-activity periods — means the configuration reflects the actual risk pattern rather than a fixed worst-case assumption applied at all times.
Similarly, maintenance shutdowns present a different detection context from live production. During a planned shutdown, the pattern of zone access is deliberately different: maintenance teams legitimately enter zones that are normally restricted, exclusion boundaries that are normal during operations may be suspended, and the vehicle-pedestrian mix in the yard may be reversed. A detection configuration calibrated for production operations will generate high false positive rates during maintenance unless the shutdown operating mode is separately configured and activated.
Using historical data to calibrate settings
After the first four to six weeks of operation, the site has enough data to move from reference-range configuration to evidence-based tuning. The key analytical question is not "how many alerts did we have?" but "what was the ratio of true positives to false positives by zone and detection type?"
An alert acknowledgement review — sampling 50 to 100 acknowledged alerts per detection type — produces the empirical answer. If a given zone-detection combination is showing a false positive rate above 15 per cent, the dwell time for that combination should be extended by three to five seconds and the threshold raised by 0.05. If the false positive rate is below 5 per cent and there have been genuine events in the review period, the configuration is broadly correct. If there have been no genuine events and the false positive rate is below 5 per cent, the zone may have been over-classified — review whether it genuinely belongs in the tier it was assigned to.
This calibration cycle should run quarterly for the first year of operation. After the first year, a six-monthly review is usually sufficient unless the site's operational profile changes materially.
The six-step tuning protocol for a new site
Zone risk tier assignment. Before touching any detection parameters, produce a risk tier map of the site. Assign every camera to a zone tier based on the hazard register and operational risk profile. Have this reviewed and signed off by the site safety manager and one operational lead.
Baseline detection type selection. For each zone tier, identify which detection types are relevant and configure only those. Do not activate all available detection types on all cameras — this is the second most common cause of alert fatigue after uniform sensitivity.
Reference-range configuration. Apply the reference parameter ranges from the configuration matrix as a starting point. Activate the system in a logging mode — detections recorded but no alerts firing — for 72 hours before going live, and review the event volume to confirm it is in a manageable range.
Phased alert activation. Activate critical-zone alerts first. Run for two weeks, review acknowledgement rates and false positive feedback from operators, and calibrate before activating controlled-zone alerts. This staged approach allows the control room team to develop confidence with the system at manageable volume before the full alert load is live.
Operational schedule configuration. Map the main operational schedules — production shifts, maintenance windows, delivery peaks, weekend reduced-manning periods — and configure time-based sensitivity rules for each. Have the site safety manager review and approve the schedule before activation.
First calibration review at 30 days. At thirty days post-go-live, pull the alert data and conduct the acknowledgement review. Identify any zone-detection combinations with false positive rates above 15 per cent and apply the calibration adjustments. Document the review and the changes made. This document becomes the baseline for future calibration cycles.
The offshore installations where SecureSafety has operated continuously since 2018 produce approximately 18,000 events per day across the estate — and a sub-0.05 per cent error rate. The reason those numbers coexist is not because the detection is configured to catch everything at maximum sensitivity. It is because each detection type on each camera has been tuned to the specific risk characteristics of the zone it covers, and that tuning has been refined through six years of calibration cycles. The discipline of zone-level tuning is what separates a safety intelligence system from a noise machine.
To discuss how zone-level tuning is approached during discovery and commissioning on a new site, book a demo.