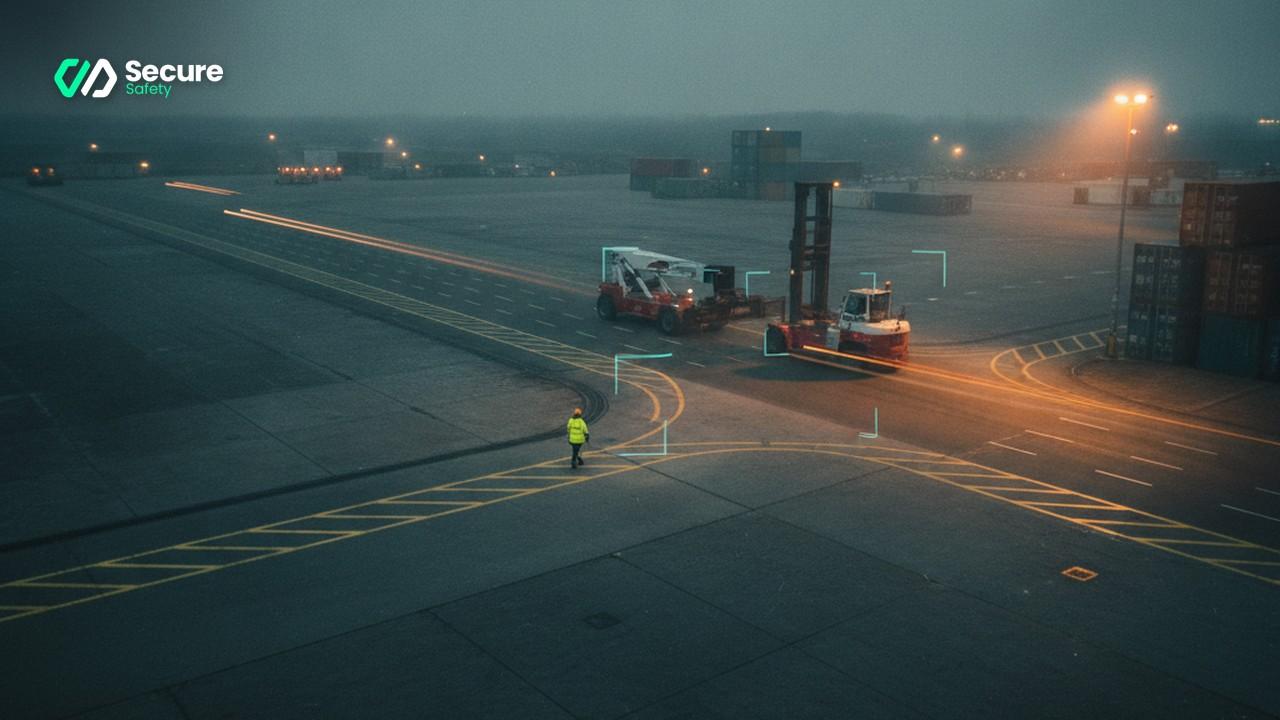
\"SecureSafety vehicle proximity detection — the near-miss data that informs site traffic redesign decisions.\"
The safety manager at a large distribution yard had drawn the pedestrian route on the site plan before the building was occupied. It ran along the eastern wall, bypassed the inbound staging area, and turned left at the secondary dock doors — a clean, logical path from the staff entrance to the racking operations. All workers and contractors signed the induction form confirming they understood it. The painted yellow lines went down on opening day.
Three years after opening, an AI proximity-detection system was deployed across twelve camera feeds covering the yard. The first conflict-frequency heatmap, produced after four weeks of continuous monitoring, showed that the designed pedestrian route was almost completely unused. The route people actually took cut diagonally across the centre of the yard, through the natural gap between two racking rows, and emerged at the canteen entrance approximately thirty metres closer than the official route. Where this desire path crossed the main vehicle route, the system had logged 847 vehicle-pedestrian proximity events in 28 days.
The paper-based near-miss log for the same period showed twelve entries.
The gap between 847 and 12 is not a reporting culture problem, though reporting culture is always a factor. It is a data capture problem. The 835 events that were not reported were not necessarily all near-misses in the traditional sense — many were routine proximity crossings that, on that occasion, resolved safely. But the pattern they describe collectively — a specific location, a predictable conflict geometry, a crossing frequency that the designed route makes almost inevitable — is exactly the intelligence needed to redesign the yard. And that intelligence was completely invisible in the paper log.
Why site layout decisions are based on theory
The pedestrian routes on most site plans are designed before the site is occupied, or during an early operational period before the real movement patterns of the workforce have established themselves. Designers draw routes that are logical, direct, and that satisfy the requirements of a competent fire safety assessor. They place the walkways where the walkways should go in a rational model of how people move through the space.
Workers, without any intention of non-compliance, navigate the space by different rules. They take the shortest route. They avoid the areas that feel most exposed. They follow the path that their colleagues are already using. When the designed route adds thirty metres and two chicanes to a walk they make twelve times a day, it quietly stops being the route they use.
This is not unique to distribution yards. It is a predictable feature of complex operational environments. HSE's guidance on workplace transport safety — Workplace Transport Safety: What You Need to Know — explicitly identifies segregation design as the primary control for vehicle-pedestrian conflict. But the guidance also notes that segregation is only effective when it is used, which requires that the segregated routes match the actual movement patterns of the people they are designed to protect.
The problem with designing routes based on the theoretical traffic plan is that the theoretical plan and the actual movement pattern diverge from day one, and the divergence is invisible until an incident reveals it. AI proximity data makes that divergence visible continuously, long before an incident occurs.
How proximity detection data reveals actual conflict patterns
Vehicle-pedestrian proximity detection identifies instances where a vehicle and a pedestrian are within a defined distance of each other — typically two to five metres for walking-speed operations, further for higher-speed vehicle environments. Every detection event is time-stamped, location-tagged by camera zone, and stored.
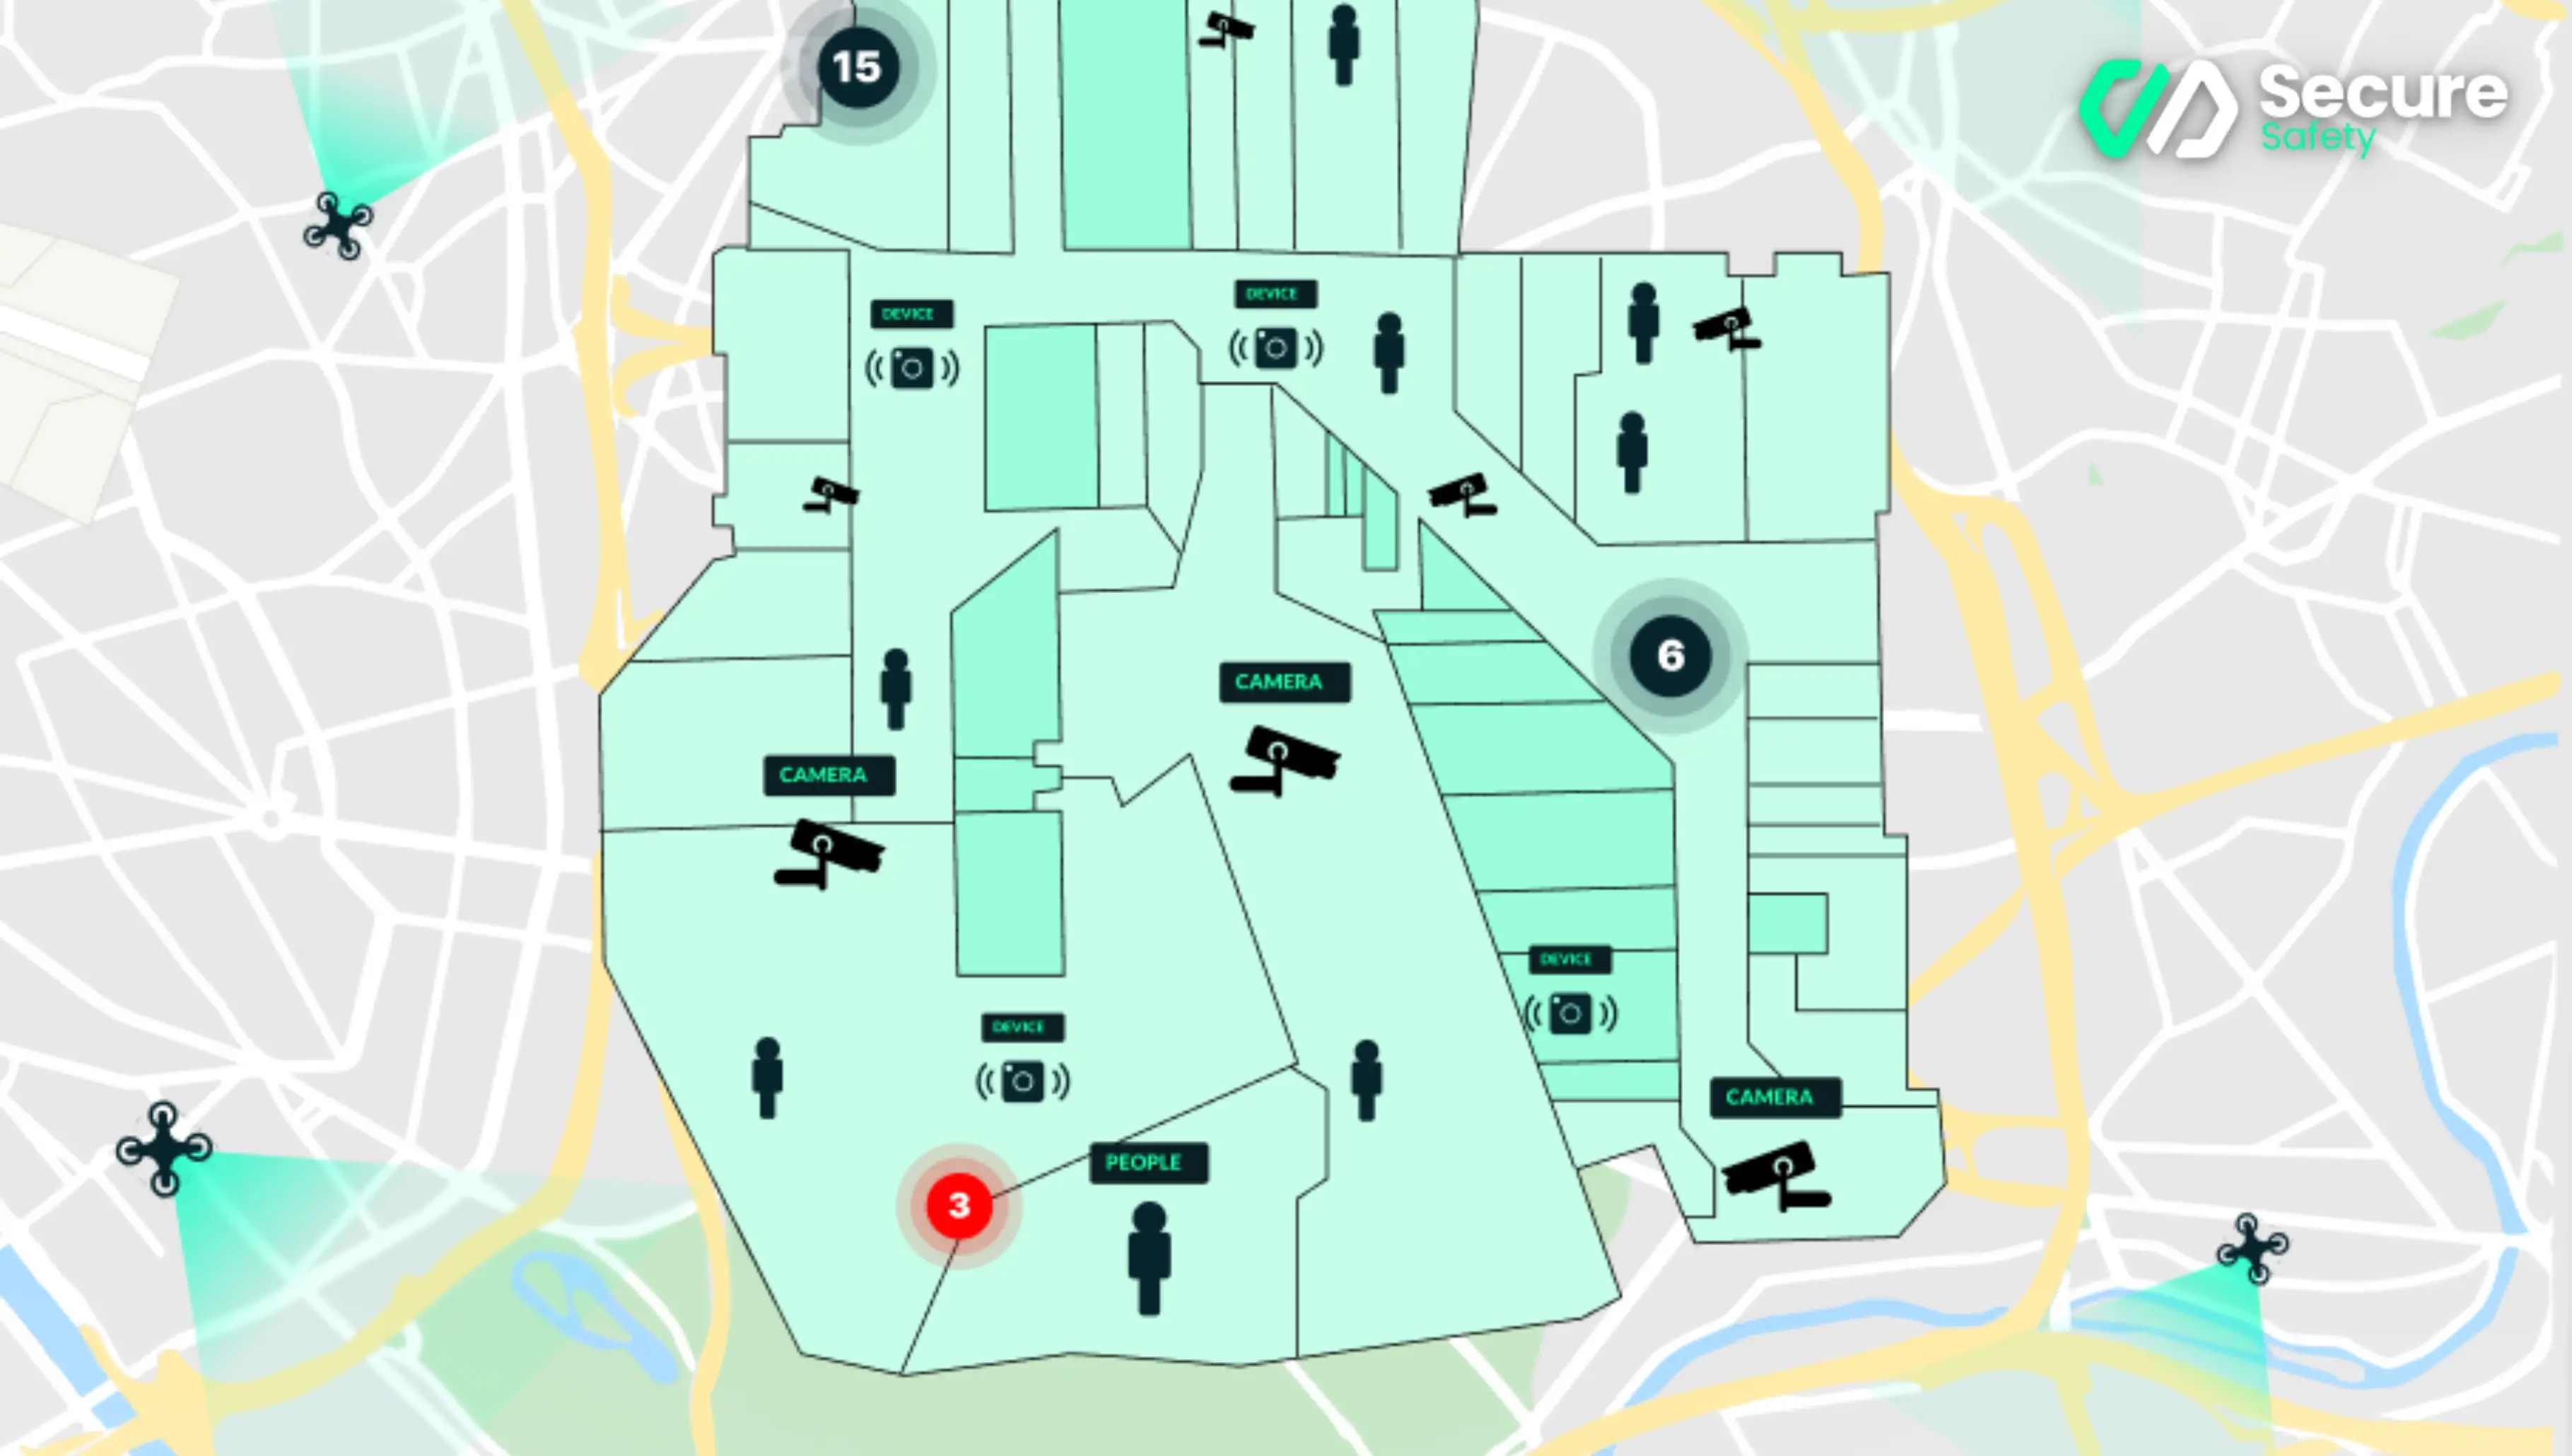 The SecureSafety conflict heatmap: after two to four weeks of continuous monitoring, the map shows where vehicle-pedestrian proximity events actually concentrate — not where safety managers assume they do.
After even a relatively short operational period — four to six weeks is typically sufficient — the accumulated data can be mapped spatially across the site. The result is a conflict-frequency map: a visual representation of where vehicle-pedestrian proximity events actually concentrate.
The conflict-frequency map almost never matches the risk assumptions embedded in the site's traffic management plan. Common findings include:
Unofficial crossing points that workers have established at locations where the vehicle route and a natural pedestrian desire path intersect. These crossings exist on no official plan, have no road markings, no warning signs, and no physical segregation. They may generate more proximity events than every official crossing on the site combined.
Blind junction concentrations where the physical layout creates sightline obstructions — racking rows, vehicle body trailers, column banks — that mean pedestrians and vehicles regularly arrive at the same point from directions where neither can see the other. These locations are identifiable from the data because their conflict event rates are disproportionately high relative to the general traffic volume passing through them.
Entry and exit pinch points where the pedestrian and vehicle routes converge because the site design allocated insufficient space to maintain effective segregation near gate entries, dock doors, and loading bay areas. These are the locations where the conflict geometry is most acute — pedestrians and vehicles moving in the same direction at the same narrow point.
Identifying these concentrations from the proximity data is the analytical foundation for a redesign programme. Without the data, the safety manager is working from intuition and incident history. With it, the top five redesign priorities are visible and quantifiable.
The redesign toolkit: what works and what does not
Once the conflict concentrations are identified, the question is what to do about them. The evidence base on workplace transport interventions is reasonably clear on what produces durable risk reduction and what produces temporary improvement.
Physical segregation produces durable improvement. Solid barriers — Armco crash barriers, concrete kerbs, raised pedestrian platforms, pedestrian-only gated corridors — change the geometry of the space permanently. A worker cannot take a diagonal short-cut across a yard that has a physical barrier across the diagonal path. Physical segregation is the most effective single intervention for persistent conflict concentrations.
Bollards and defined pedestrian crossings with physical priority work when properly designed. A raised pedestrian crossing — a speed table that forces vehicles to slow to a safe speed before the crossing point — combined with a clearly marked and physically bounded pedestrian waiting area is significantly more effective than a painted crossing with no physical enforcement. The data consistently shows that painted crossings without physical enforcement improve compliance briefly after installation and gradually return to pre-intervention conflict frequencies as the novelty fades.
One-way vehicle systems resolve head-on conflict geometries. In yards where conflict concentrations are driven by vehicles and pedestrians approaching each other from opposite directions at low-visibility corners, establishing a one-way vehicle circuit with segregated pedestrian entry routes eliminates the head-on geometry entirely. The physical changes required are often modest — additional signage and barrier placement — but the risk reduction is substantial if the one-way system is actually followed.
Segregated pedestrian gates reduce dock door and gate entry conflicts. Providing a pedestrian gate that is physically separated from the vehicle entrance by at least three metres removes the conflict pinch point at the site perimeter. Where the site currently has a shared vehicle-pedestrian entrance, a pedestrian-only gate with a physical barrier between it and the vehicle lane is typically the single highest-return infrastructure investment for a site with a gate-area conflict concentration.
What does not produce durable improvement: additional signage at conflict locations, speed limit reductions in vehicle areas without physical enforcement, verbal instruction to workers to use designated routes, and general "improved awareness" campaigns. These interventions are appropriate as supplementary measures. They do not substitute for physical controls, and the conflict frequency data will typically show this clearly in the before-and-after comparison.
Section 2 of the Health and Safety at Work etc. Act 1974 requires employers to provide and maintain safe systems of work. A traffic management system that is designed around a theoretical movement plan rather than the actual movement pattern of the workforce does not satisfy that duty, however well intentioned its design was at the time.
The near-miss-to-redesign process
The following process converts AI proximity data into prioritised physical interventions and then measures whether those interventions have worked.
Step one: baseline data period. Run the proximity detection system for a minimum of four weeks without any changes to the site layout. This establishes the baseline conflict-frequency map against which improvements will later be measured. Document the operational context — shift patterns, seasonal factors, recent changes to vehicle or pedestrian volumes — so that later comparisons are valid.
Step two: conflict concentration analysis. Export the proximity event data for the baseline period and plot it against the site layout map. Identify the top five conflict concentration zones by event frequency. For each zone, note the conflict geometry: are events clustered at a specific crossing point, distributed across a general area, or concentrated at a specific time of day or shift?
Step three: root cause assessment for each concentration. For each top-five concentration, determine whether the primary driver is a desire-path conflict (workers not using the designated route), a sightline obstruction conflict (pedestrians and vehicles unable to see each other at a junction), a pinch-point conflict (insufficient space for segregation at a gate or dock door), or a time-concentration conflict (a specific operational activity that brings vehicles and pedestrians to the same location simultaneously). The intervention type follows from the root cause type.
Step four: prioritised intervention design. Design an intervention for each of the top five concentrations, prioritised by a combination of conflict event frequency and consequence severity. A location with 300 events per week at a busy dock door has higher priority than a location with 300 events per week in a low-speed general circulation area.
Step five: implementation. Install the physical interventions. For significant infrastructure changes — new barriers, a new one-way system, a new pedestrian gate — conduct a temporary arrangement review after installation to confirm the change has not introduced a new conflict geometry elsewhere.
Step six: post-intervention measurement. After a minimum of four weeks following implementation, run the same conflict-frequency analysis on the post-intervention data for each modified location. Compare the event frequency at each location against the baseline. A successful intervention produces a measurable reduction in conflict event frequency at the modified location, without a corresponding increase at adjacent locations that would indicate the traffic has simply been displaced.
Three common layout problems revealed by AI data
Problem one: the diagonal desire path. Workers consistently cross a yard diagonally rather than using the designated perimeter walkway, because the diagonal saves two to three minutes per round trip. The AI data shows a high-frequency conflict concentration at the point where the diagonal crosses the main vehicle route — a crossing that has no markings, no warning, and no physical protection. The intervention: a physical barrier that prevents the diagonal crossing and redirects foot traffic to a safe, signposted crossing point on the vehicle route. Post-intervention measurement typically shows an 85 to 95 per cent reduction in events at the original diagonal crossing, with a modest increase at the new crossing point where the redesigned route is now correctly sited.
Problem two: the blind dock-door corner. A racking bank creates a right-angle blind corner between the receiving dock doors and the footpath from the staff welfare block. Vehicles reversing out of dock doors and pedestrians walking to the welfare block arrive at the corner simultaneously with no sightline. The AI data shows the event concentration is sharp and location-specific — not distributed across the dock area generally but clustered at the single corner. The intervention: a convex mirror at the corner, a painted pedestrian holding line on the approach, and a physical pedestrian-priority zone demarcated by floor-level delineator posts. Post-intervention events at the corner reduce by approximately 70 per cent within the first four weeks.
Problem three: the shared gatehouse entry. Vehicles and pedestrians share the same gate entry, with no physical separation. At shift change, when pedestrian volumes are highest, the conflict event frequency spikes sharply. The AI data shows the gate entry accounts for 30 per cent of all site proximity events despite being a small fraction of the total site area. The intervention: a pedestrian-only gate installed two metres from the vehicle gate, with a concrete kerb-and-barrier separation preventing mixed use. The shift-change conflict spike disappears from the data within the first monitored week after installation.
On the offshore installations where SecureSafety's proximity detection has been operating since 2018, the value of the conflict-frequency data has proven as significant as the real-time alert capability. The alert catches the event. The data prevents the pattern. On a busy rig with 18,000 daily monitored events across the estate, the patterns that the data reveals — about which deck areas, which shift periods, and which operational activities concentrate vehicle-pedestrian conflict — directly inform the engineering controls that reduce the frequency of those events before they become incidents. That is what leading indicators are for.
To discuss how vehicle-pedestrian proximity data can be used to evaluate and improve your site's traffic management layout, book a demo.